Introduction to Expert Center
Expert Center combines AI-powered automation with targeted human expertise to create knowledge graphs for the built world in days instead of months.
Hierarchy
Expert Center organizes data in a three-level hierarchy:
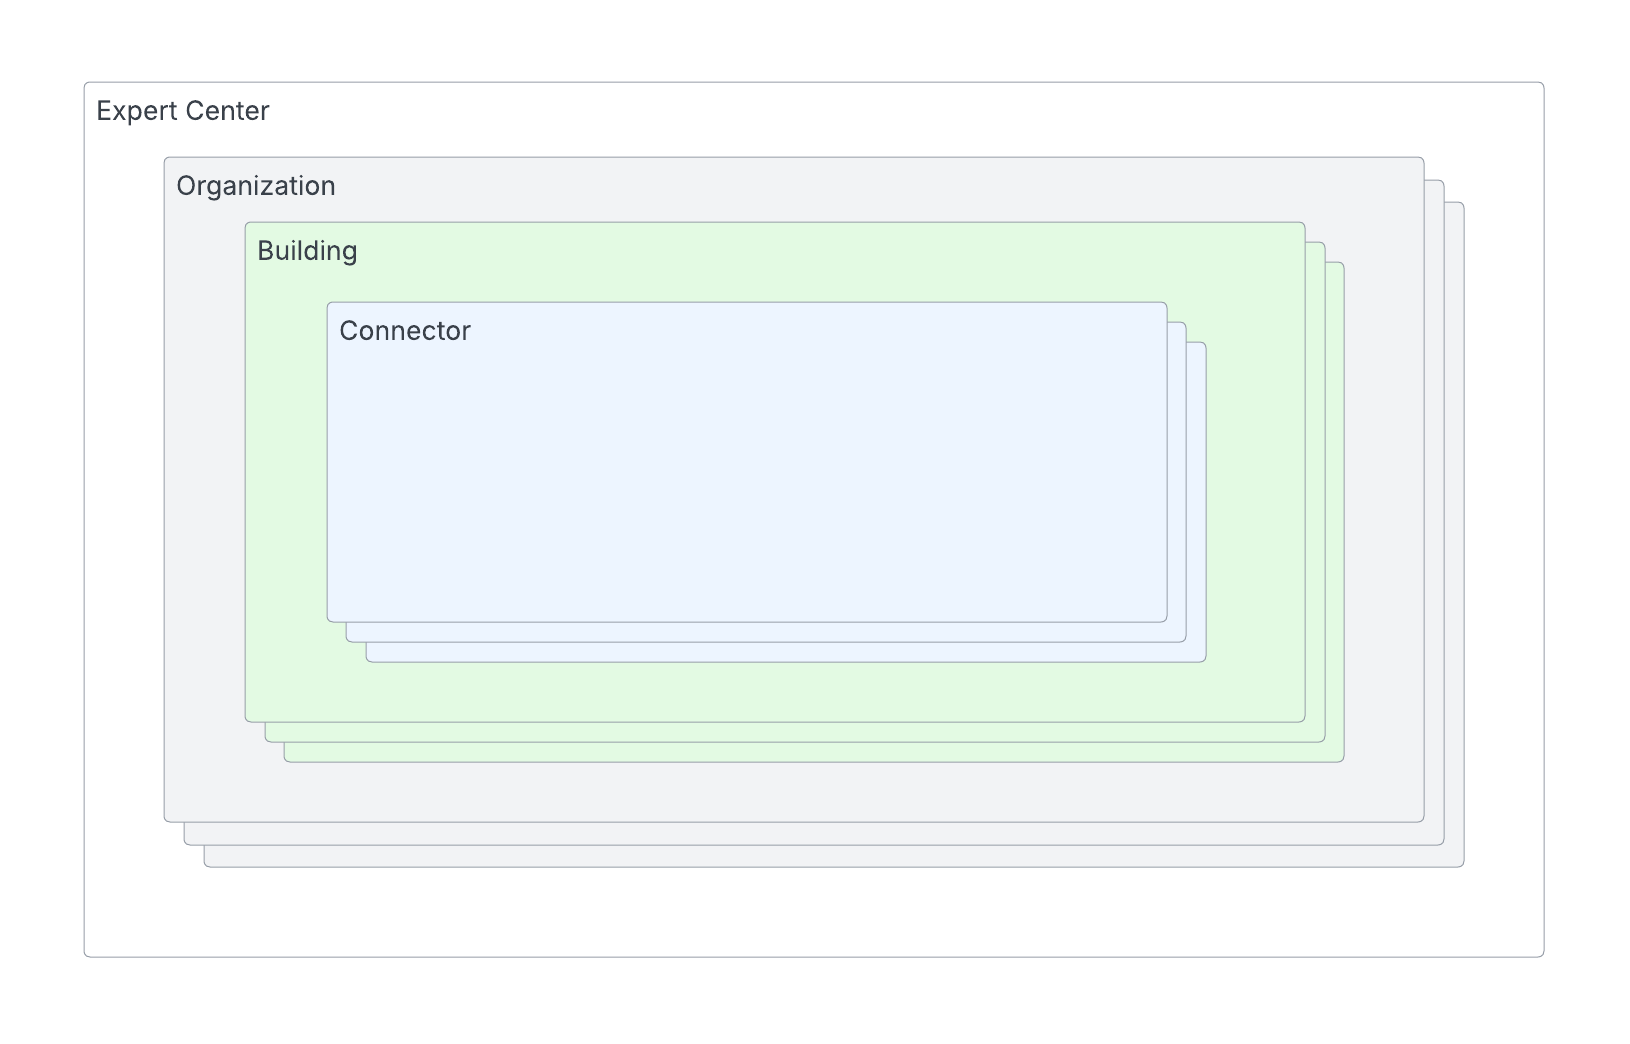
Organization → Building → Connector
- Organization: Your company or client account
- Building: Individual facilities within the organization
- Connector: Data sources within each building (BMS, IoT, Engineering Drawings, etc.)
Understanding Entities
An Entity in Mapped is a distinct object, concept, or space within a building that serves as a core unit for organizing and representing data. Entities can represent anything from sensor readings and equipment to rooms and logical groupings, and they include attributes like name, description, object type, and more. Most commonly, entities are Points, Things, Places or Collections.
We'll review different types of entities in more detail for each of the seven stages to enrichment. Read more about Entities in the FAQs.
Seven Stages to Enrichment
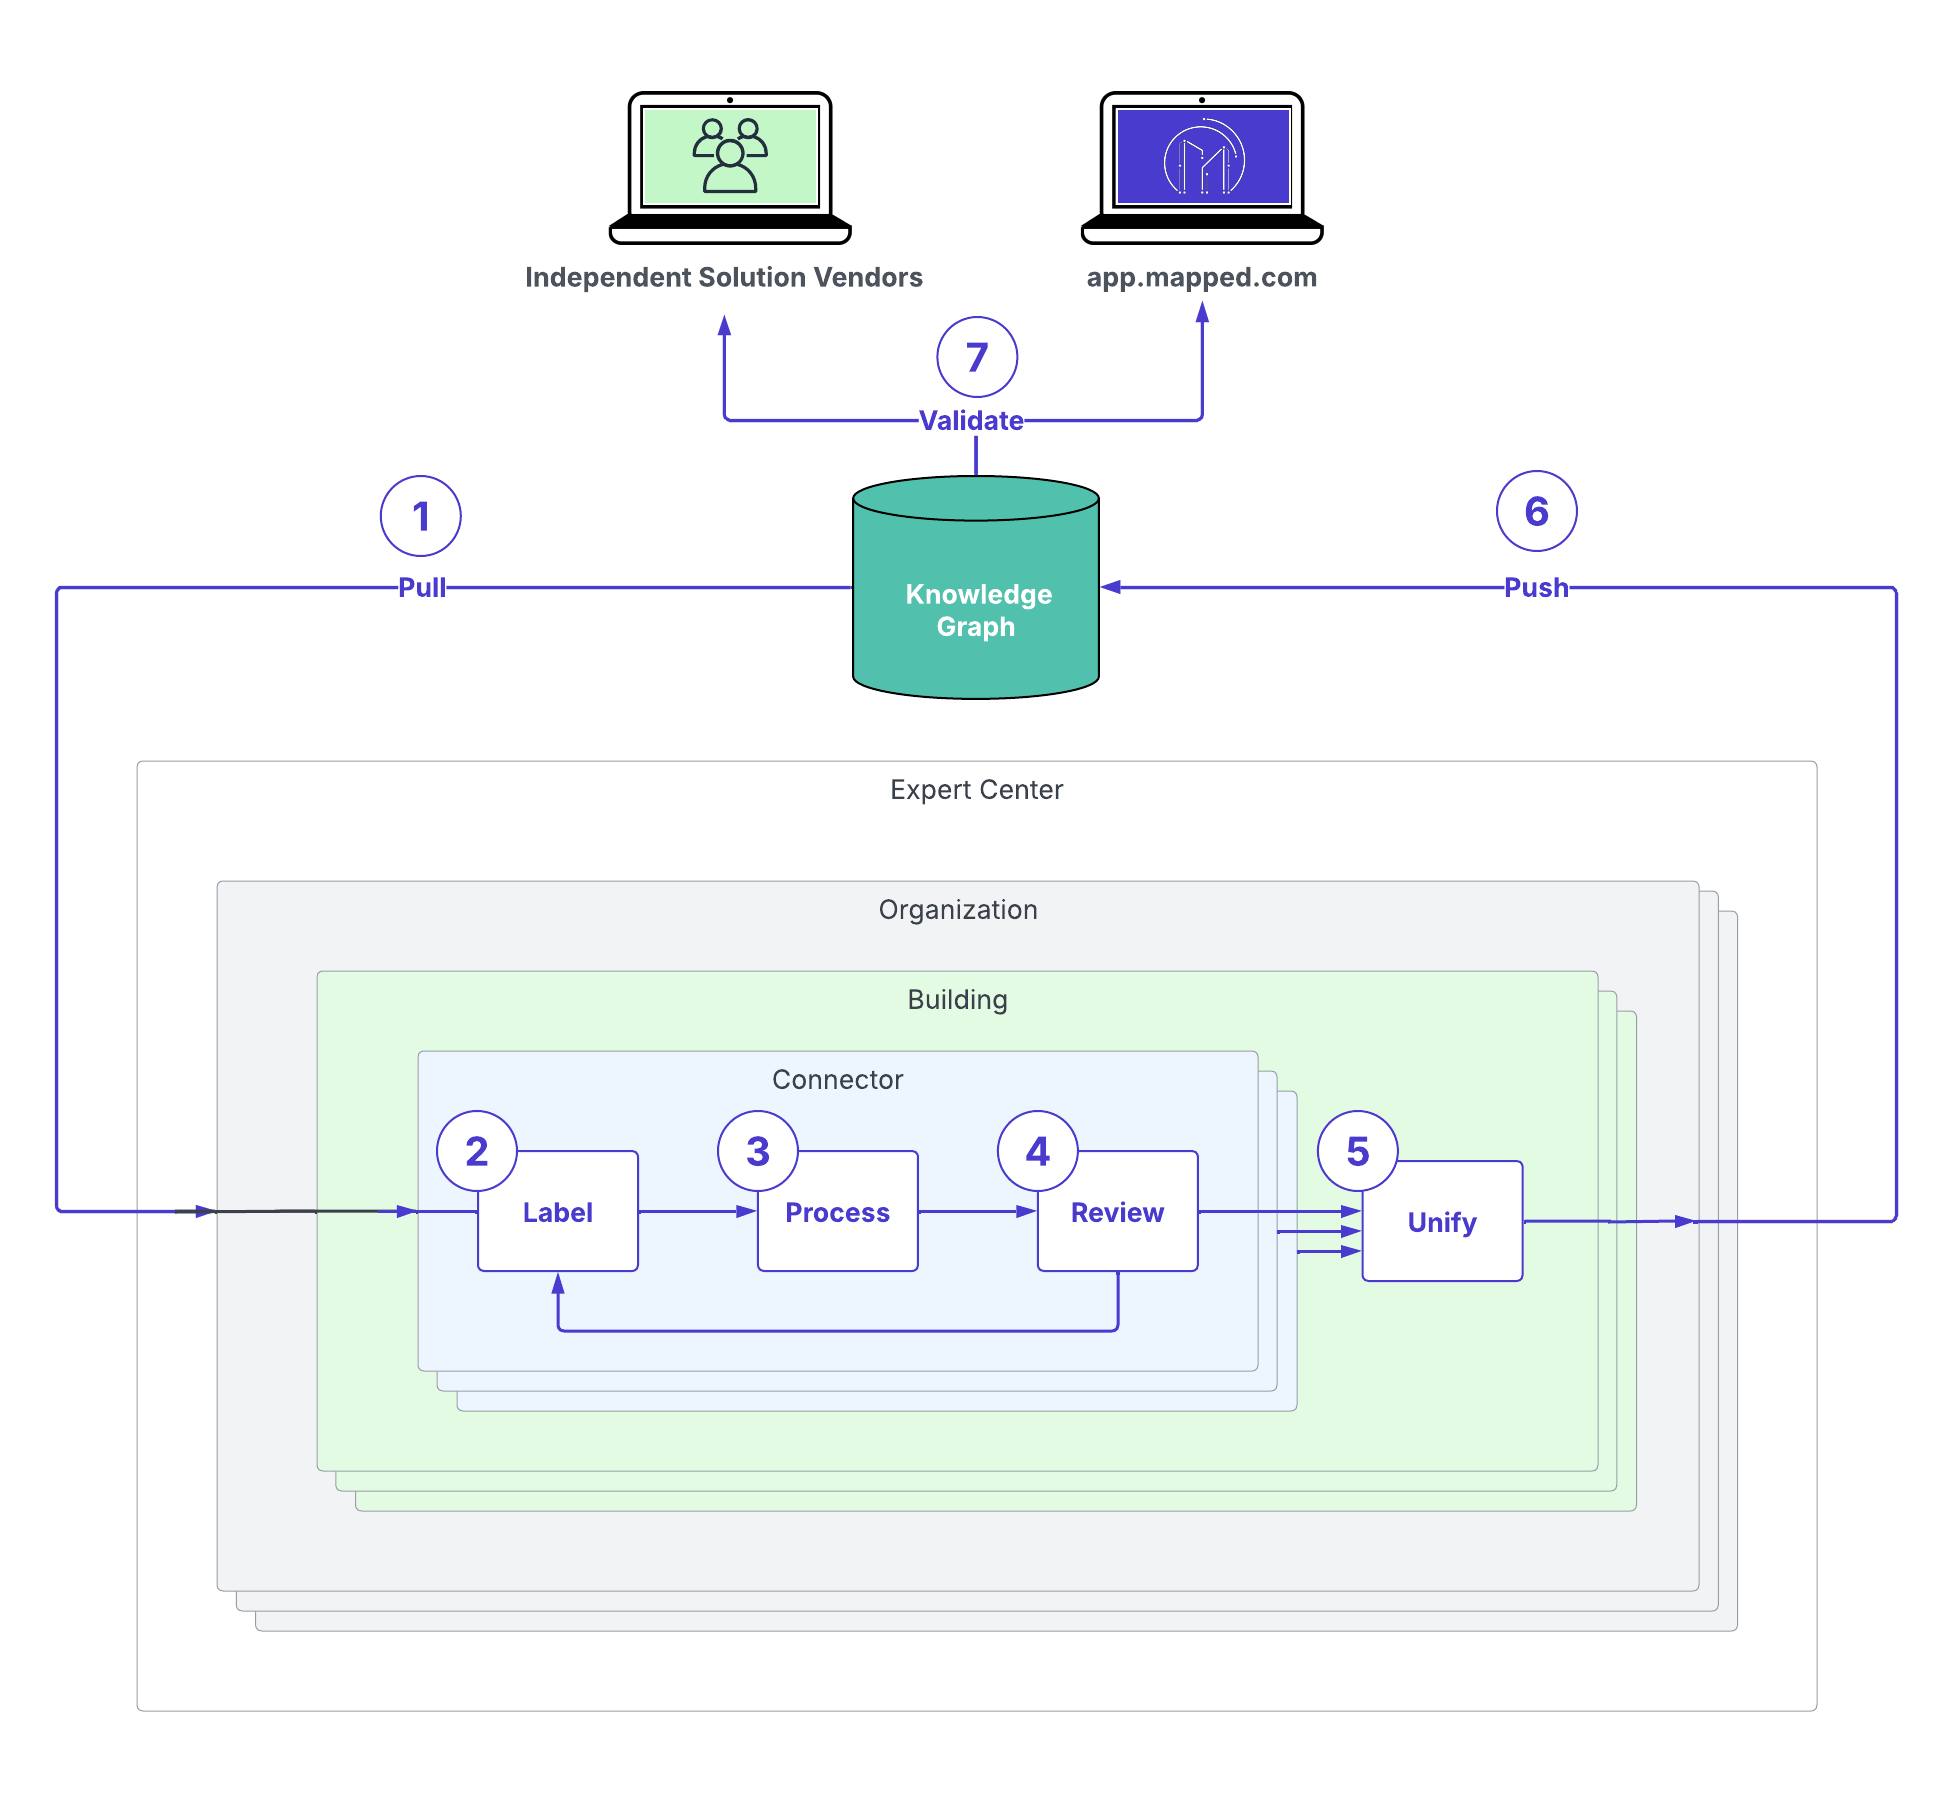
Stage 1: Pull
When you Pull, you ingest an organization’s data from the knowledge graph. Continue reading through the Pull Stage.
- Input: An organization’s knowledge graph with raw data
- Output: Buildings and connectors loaded into Expert Center with their associated entities
Stage 2: Label
Through labeling, you'll manually enrich entities with classifications, derived entities, and relationships between entities. Continue reading through the Label Stage.
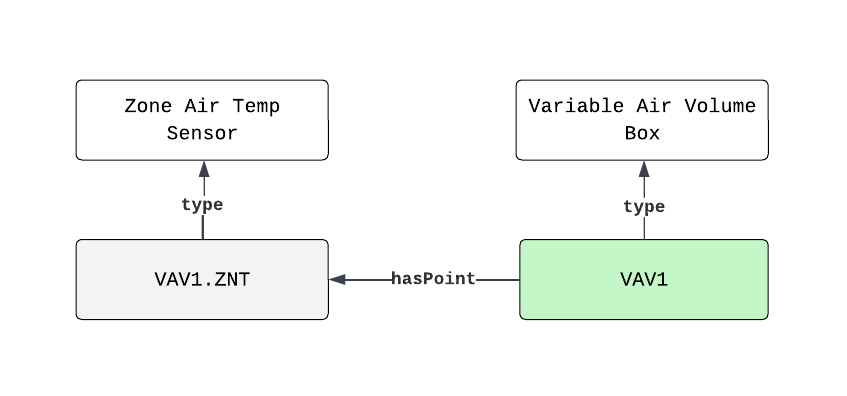
- Input: Raw entities (e.g., "VAV1_ZNT")
- Output: Labeled entities with:
- Classifications (e.g., Zone Air Temperature Sensor)
- Derived entities (e.g., VAV1)
- Derived Relationships (e.g., VAV1 has a ZNT point)
Stage 3: Process
With this step, you'll apply AI models to process remaining entities. Continue reading through the Process Stage.
- Input: ~0.5-5% labeled entities are used as training data
- Output: AI predictions for all entities include confidence scores (Low/Medium/High)
Stage 4: Review
Through Review, you'll evaluate AI predictions and correct any errors. Continue reading through the Review Stage.
- Input: Inferred entities with confidence scores
- Output:
- Approved inferences (confirmed correct)
- Declined inferences (sent back to labeling queue)
Based on the review results, you may need to return to the labeling stage to improve model accuracy.
Stage 5: Unify
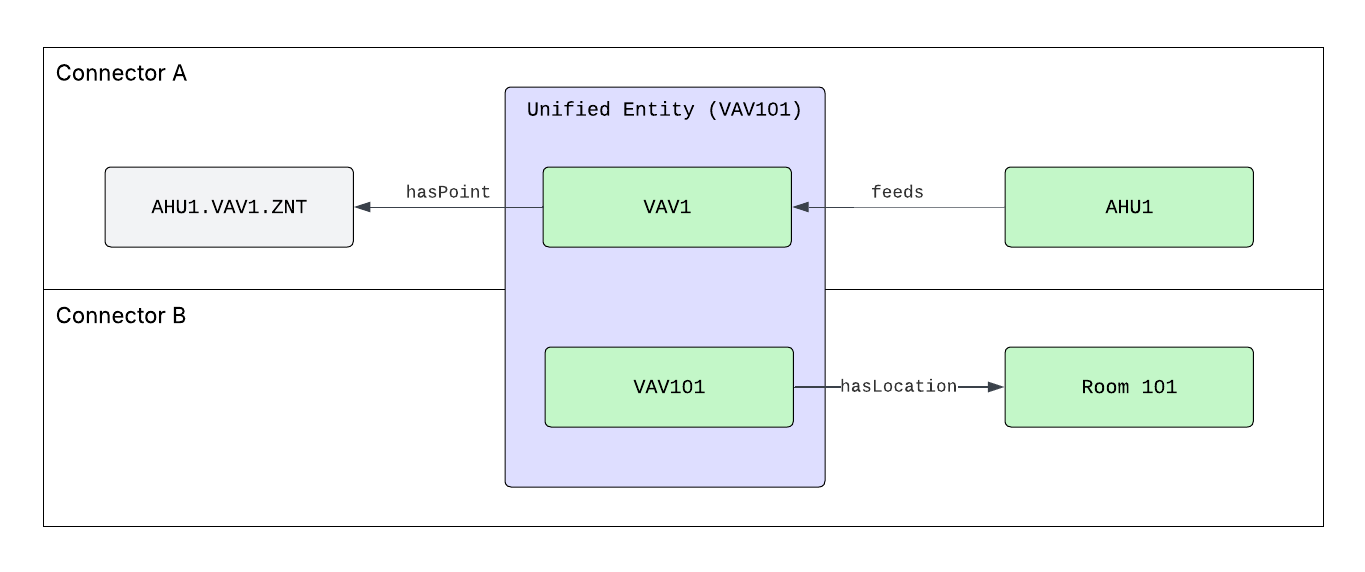
Unification merges duplicate entities across data sources. Continue reading through the Unify Stage.
- Input: Inferred Source and Derived entities from a building’s connector(s)
- Output: Single unified entities representing physical equipment. For example, an entity known as AHU1 from your BMS combined with "Air Handler 1" from the CSV source connector becomes one unified AHU1.
Stage 6: Push
The Push step sends enriched data to the knowledge graph. Continue reading through Push Unify Stage.
- Input: Model in Expert Center
- Output: Knowledge Graph updated with changes made in Expert Center
Stage 7: Validate
You'll complete this process by inspecting enriched data in the knowledge graph.
- Input: Updated knowledge graph with enriched building data
- Output: GraphQL query results confirming data structure and relationships
Getting Started
Ready to begin?
Follow our Step-by-Step Building Onboarding Guide for instructions on implementing each phase within Expert Center, or continue with Stage 1: Pull.