Monitoring Connectors with Grafana
What's Grafana?
Grafana is an open-source analytics and monitoring platform that allows you to visualize time series data through customizable dashboards. Prometheus is a popular option to store time series metrics, and Grafana lets you query and visualize that data.
How does it work?
Connectors use the OpenTelemetry SDK to push metrics to the OpenTelemetry Collector, which caches the latest metrics for 1 hour. Prometheus scrapes the Collector every 1 minute and stores the data for 6 months on disk.
Access Connector Metrics via Grafana with Prometheus
Prerequisites
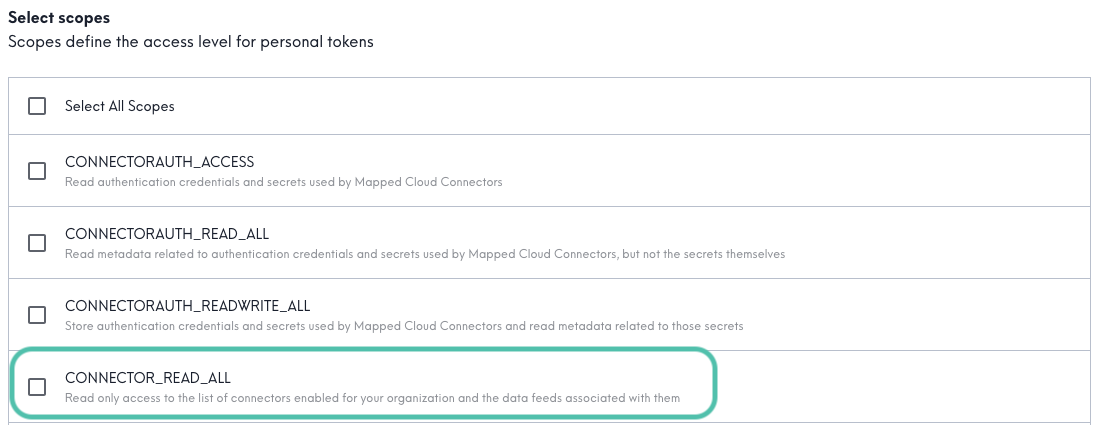
Create a Personal Access Token with CONNECTOR_READ_ALL scope.
Note: Select CONNECTOR_READ_ALL in order to read all the connectors enabled for your organization and the data feeds associated with them. Do not select CONNECTORAUTH_READ_ALL, as a PAT with this scope will not enable Grafana access.
Configure the data source
First, log into Grafana (your company's instance).
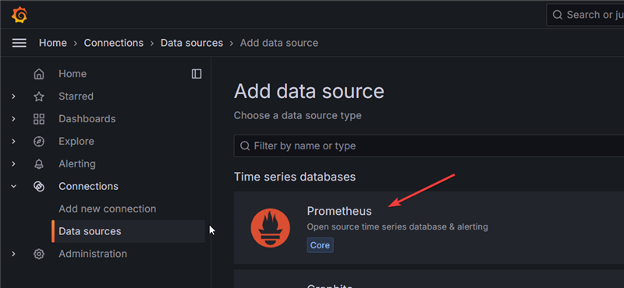
Select Connections > Data Sources and select Prometheus.
Under Connection, for the Prometheus Server URL enter this server:
1https://api.mapped.com/metrics
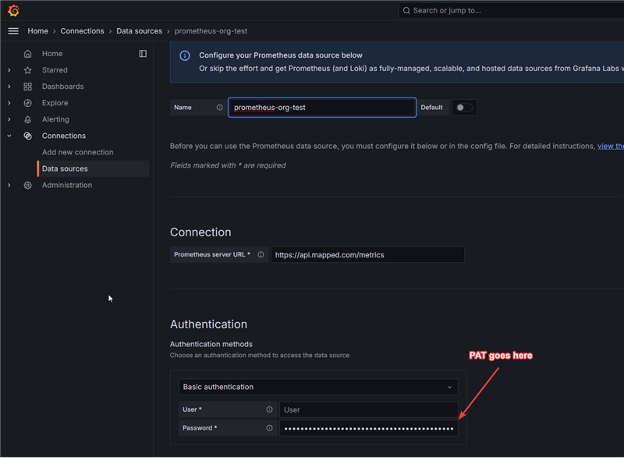
Under Authentication, select Basic authentication and enter your Personal Access Token in the Password field.
Select Save & test, and wait for a green success message Successfully queried the Prometheus API to confirm.
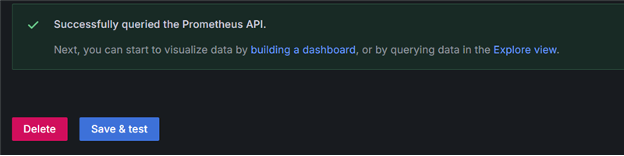
If the save fails, double check the scope of your Personal Access Token. Its scope should be CONNECTOR_READ_ALL.
Explore Metrics
You can filter with these attributes:
- org_id - Your organization's unique identifier
- connector_id - A specific connector's unique identifier
- connector_type_id - The type of connector (e.g., "airthings", "cisco-spaces")
Key metrics
- destination_connector_egress_bytes_sum: Total bytes sent to a destination connector over time.
- total_contribution_bytes_sum: Total bytes ingested into Mapped’s graph by a source connector (includes time series & merged data).
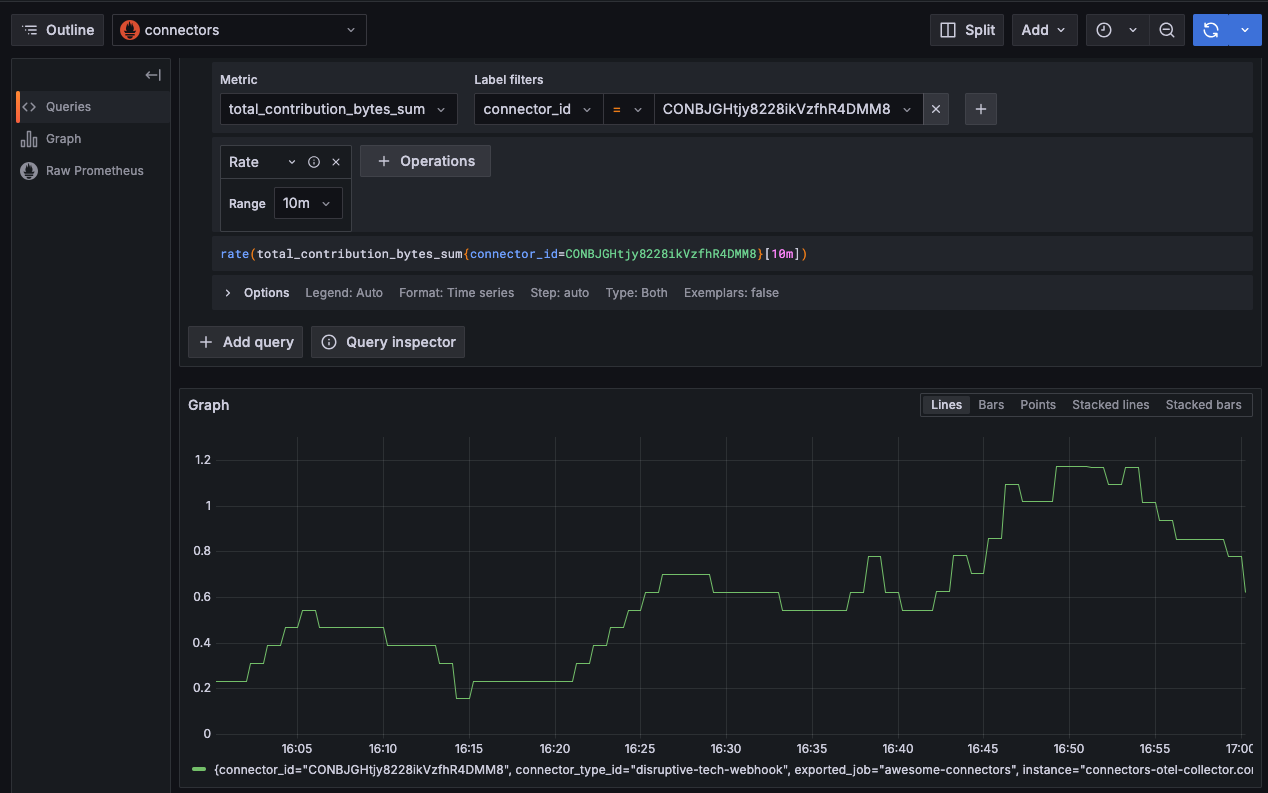
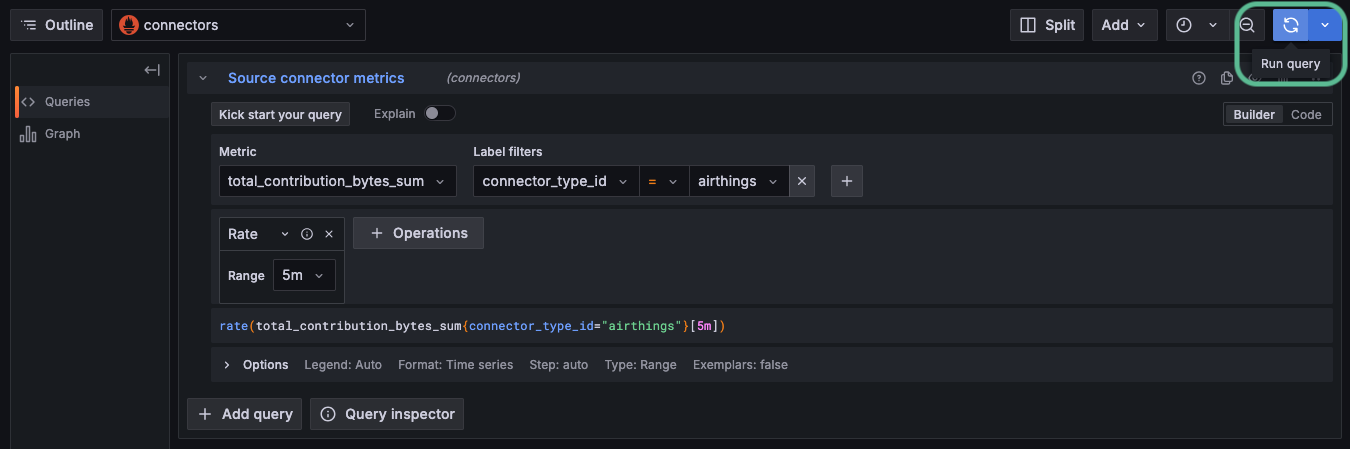
Build a query
In Grafana, select the Explore tab.
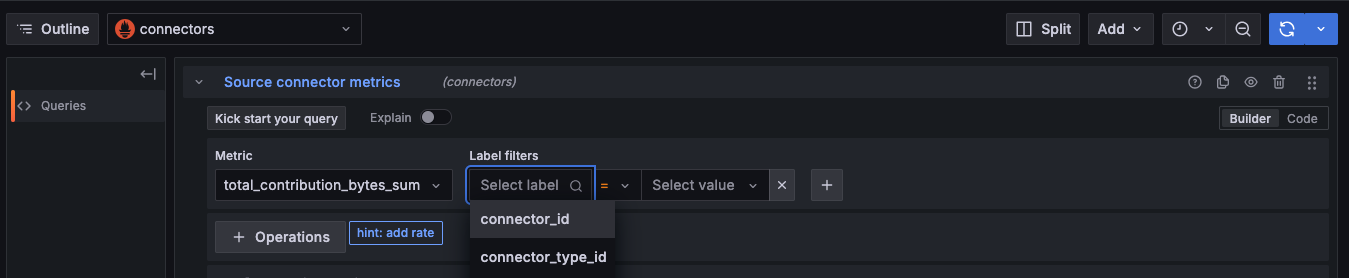
First select the Metric desired: destination_connector_egress_bytes_sum for destination connectors, or total_contribution_bytes_sum for source connectors.
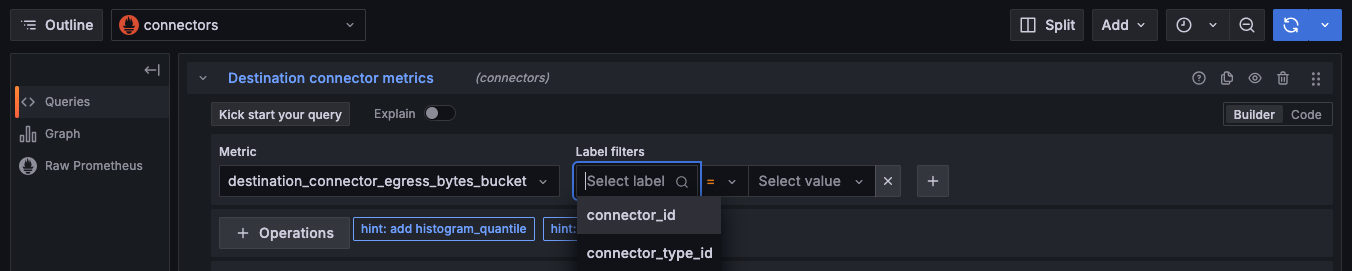
Select attributes for filtering underr Label Filters. Select connector_id, connector_type_id or org_id. Enter the identifier under Value.
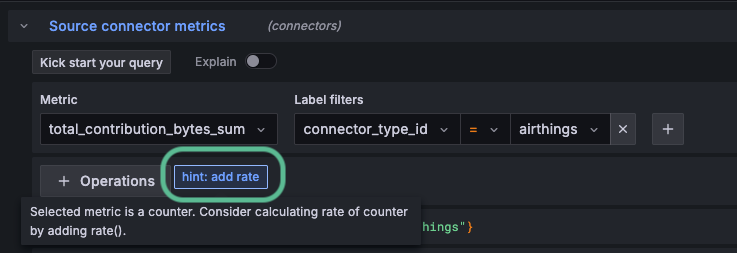
Click the helpful hint: add rate to adjust the interval of the histogram displayed.
Click the Run Query button in the upper right to run your query and view results.
The graph will display the metrics for the past hour as a histogram. A histogram represents the distribution of numerical data. You can toggle the graph between lines, bars, points, stacked lines, and stacked bars to illustrate the frequency within your selected interval.